1. Introduction
The fast-moving consumer
goods industry is one of the key contributors to the Indian economy. The FMCG
sector accounts for the fourth-largest sector in the economy, with household and personal care being the leading segment accounting for 50
percent of shares. The main growth drivers for FMCG have been increasing
income, changing lifestyles, increasing awareness, and easier access. Besides,
the trend toward sustainable products also influences consumers’ purchase behavior.
Dabur
India Limited is one of the leading fast moving consumer goods (FMCG) players
dealing in consumer care and food products. It is the 4 th largest FMCG company
in India and a leader in Ayurveda globally. Dabur operates in key consumer
products categories like Hair Care, Oral Care, Health Care, Skin Care, Home
Care and Foods.
The
company has various brand leaders in different market segments - Dabur
Chyawanprash (a health tonic) and Hajmola (a digestive tablet). Real, launched
during 1996-1997, has also successfully become the leader in the market. The
company has a wide distribution network, with a high penetration in both urban
and rural markets. It has its manufacturing presence across 9 countries.
Dabur
has identified 9 Power Brands – Dabur Chyawanprash, Dabur Honey, Dabur Lal
Tail, Dabur Honitus, Dabur Pudin Hara, Dabur Red Paste, Dabur Amla Hair Oil,
Vatika and Real fruit juice.
2. Literature
review
Bagchi.B
& Khamrui.B (2012) investigated the relationship between working capital
management and firm profitability and to identify the variables that most
affect profitability. Working capital management is considered to be a vital
issue in financial management decision and it has its effect on liquidity as
well as on profitability of the firm. In this study, we have selected a sample
of 10 FMCG (Fast Moving Consumer Goods) companies in India from CMIE database
covering a period of 10 years from 2000–01 to 2009–10. Profitability has been
measured in terms of return on assets (ROA).Cash conversion cycle (CCC),
interest coverage ratio, age of inventory, age of creditors, age of debtors and
debt-equity ratio have been used as explanatory variables. Pearson’s
correlation and pooled ordinary least squares regression analysis are used in
the study. The study results confirm that there is a strong negative
relationship between variables of the working capital management and
profitability of the firm.
S M
Imamul Hoque and Mohd Atif Afzal (2017), ‘An appraisal of financial performance
of the FMCG industry in India’. This study states that, there is significant
impact of sales on liquidity position of selected FMCG companies, there is no
significant impact of sales on solvency position of selected FMCG companies and
there is significant impact of sales on profitability position of FMCG
companies. The study included the time period of five years i.e., 2011-12 to
2015-16.
Tamragundi
& Vaidya (2016) says FMCG industry plays a significant role in shaping a
country’s economy and development. he FMCG sector has grown at an annual
average of about 11 per cent over the last decade. Their work examined the
relationship between profitability and liquidity on ten leading FMCG companies
in India for the period of 2005-06 to 2014-15. Profit is the propulsive element
of any investments in different projects and observed that for FMCG companies
there is not a dilemma between Liquidity and Profitability.
Shivanisinh
Shailesh Kumar Parmar (2017) in his research paper ‘A study on financial
efficiency of selected FMCG companies in India’, it evaluated various financial
ratios and provided conclusion upon 7 companies on the basis of financial
ratios. This study included seven FMCG companies and time period included in
this study is 10 years that is 2007-2015.
Patel,
Harish., Patel, Dr. V. B. (2018) aimed to analyze fundamental position of major
listed FMCG companies using ratios. The aim of study is P&G, NESTLE, ITC,
DABUR, and HUL. Analysis was done using past three-year computed date of income
Margin Ratio, profits margin, Price to Earnings, Debt to equity ratio, Dividend
payout ratio, Earnings per share starting April 2016 to March 2018.This study
provides a specific presentation of data and guidelines which can help a fresh
investor likewise as a venture investor to understand vital aspects of
investing. This study helps to the investors to make a decision on a secure
investment and to identify the expansion opportunities within the long run.
3. Objectives:
1. To
know about the Dabur India Ltd.
2. To
analyze the financial position of Dabur India Ltd. company.
4.
Research Design
The present study is a descriptive study which tries
to analyze financial position of the Dabur India Ltd. Company. The research
undertaken was quantitative research as it was concerned with numerical,
applied statistics, and use of graphs and tables.
5.
Data Collection
The
data for this project is collected with the help of only secondary data.
6.
Source of Data Collection
The study is based on secondary data which is
collected from the published financial statements viz., Trading and profit and
loss account and balance sheet contained in the annual report of the selected
Dabur Ltd.
7.
Period of the Study
The study period
cover 2 years for 2022-23 to 2023-24.
8. Data
Analysis
|
Year
|
Net Profit Margin (%)
|
Current Ratio
|
Quick Ratio
|
EPS
|
Asset Turnover Ratio
|
Inventory
Turnover Ratio
|
|
2022-23
|
14.76
|
1.18
|
0.61
|
9.64
|
0.8
|
2.22
|
|
2023-24
|
14.6
|
1.45
|
0.94
|
10.4
|
0.86
|
2.61
|
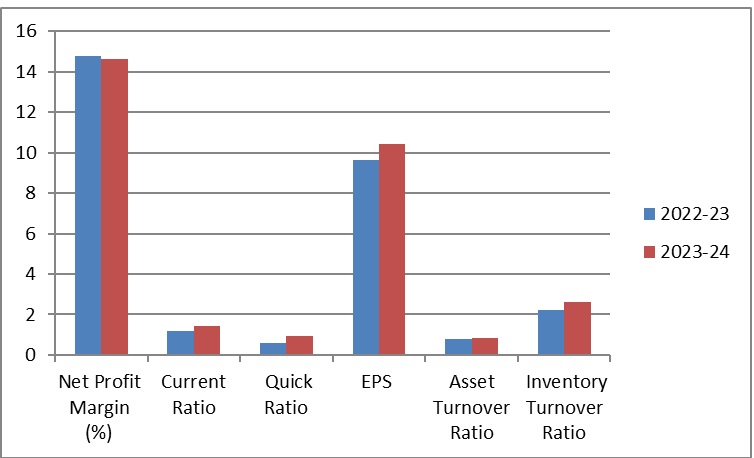
The
graph shows values of 6 accounting ratios for Dabur Ltd. and Net Profit Margin
of Dabur Ltd. is the highest.
In
the above table the Net Profit Margin (%) of Dabur Ltd. for the year 2023-24 is
decrease than the previous year. A higher profit margin indicates a more
profitable company that has better control over its costs.
The current Ratio (%) of Dabur Ltd. for the year
2023-24 is increase than the previous year. It shows the sound financial
position of Dabur ltd. The quick ratio for Dabur India Ltd. is almost 70%
increase 0.60 to 0.94 respectively for the year. We
infer that Dabur has the ability to pay off its liabilities.
Earnings per Share have risen from 9.64 in 2022-23 to
10.4 in 2023-24. This ratio indicates the ability of the firm’s assets to
generate operating income. As a rule of thumb, the higher this ratio is the
better. It is important to realize that this ratio shows the return
shareholders are actually achieving on their investment, using current market
value for listed shares.
The Asset turnover of Dabur Ltd. for the year 2023-24
is increase than the previous year. We
conclude that it uses its assets very effectively to generate revenue or sales.
In the above graph, Inventory Turnover Ratio is shows
2.61. This ratio indicates whether investment in inventory is within proper
limit or not.
9.
Limitation of the study
1.
This study is mainly depends on secondary data in annual report of Dabur India ltd.
2. The study is
based on analyzing the financial position of Dabur India ltd only. Hence it is
not applicable to other companies.
10. Conclusion
The
researcher investigated and analyzed the financial performance, liquidity, and
profitability position of Dabur India Ltd. by applying various accounting
ratios. On studying the financial performance analysis of Dabur India Ltd. for
a period of two years from 2022-23 to 2023-24, the study reveals that the
financial performance is better. However it needs to minimize the operating
expenses to get high net profit margin. Dabur India has efficiently control its
current assets and liquid assets to pay its current liabilities so that the
creditors of the company feel secured about the repayment of their amounts by
the company. Sales turnover has to be improved by checking expenses that
influences the sales. Inventory management of the concern is satisfactory.